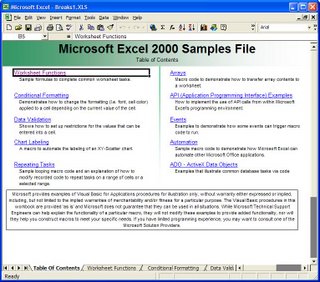
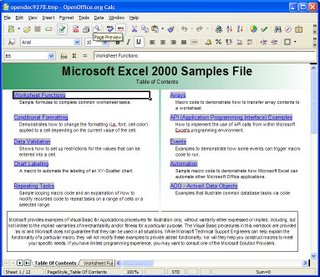
Xena Lite has a bit of a memory problem. It often seems to grow to using almost 100MB of memory... but calls to System.gc (garbage collection request) do not seem to reduce the usage. Bizarrely enough, minimising the application
does cut the memory usage back to about 5MB, and it only jumps back to 15MB when the window is restored. In addition, viewing large documents (such as a 60MB PDF) have caused out-of-memory errors, which were only alleviated when the heap size was increased to 500MB! Out of memory errors have also occasionally occurred when normalising large numbers of files.
To investigate this problem properly we needed a Profiler of some sort. I have spent much of the last week investigating the options. I downloaded trial versions of the below products and attempted to memory profile Xena Lite with each.
Before starting I should mention that the various Eclipse plugins for these profilers "don't play nice together", I found that I had to remove all other profilers completely before the new profiler would work properly.
Eclipse Test and Performance Tools PlatformThe TPTP is an Eclipse plugin which comes with a set of default tools. Installation is not straightforward as 3 or 4 separate downloads are required, plus a monitoring agent needs to be installed as a service. Once started the profiler worked well enough, and having the profiler as a part of Eclipse with the ability to open up the source files directly is definitely a plus. However the memory profiling tool was a little basic for our needs. It shows a list of the currently allocated objects, the object that allocated each of them (but not for primitives or arrays), and these can be sorted in order of size. And that's about it.
BEA JRockitJRockit is a Java 5 JDK produced by BEA, which happens to ship with profiling tools. Installation was easy, but finding how to start it up was difficult as the start menu only contained an uninstall target, and the installation directory contained a large amount of command-line executables. jconsole.exe turned out to be the correct option, and this brings up an application with a "Connect to agent" dialog, which was a little confusing... after some experimentation it turned out the best option was to select the "Remote" tab and just go with the default options. Then I needed to start Xena Lite using the JRockit JRE, and this brought up the profiling console. Unfortunately this profiler is even more basic than the Eclipse TPTP, only consisting of guages showing the current memory levels, CPU utilisations and garbage collection state. So fairly pointless, really.
Rational PurifyPlusWe had great hopes for IBM's Rational PurifyPlus, as we figured that it would have the greatest level of integration with Eclipse. However the latest version of PurifyPlus was produced in 2003, which did not bode well for use with Java 5 or Eclipse 3.1. And this turned out to be the case - I copied the Eclipse plugins from the install directory over to the Eclipse directory, but only the PurifyPlus help files were installed properly. The standalone application failed when trying to run Xena Lite, most likely because it only supports Java 1.4.2. You'd think they'd be due for an update soon, I guess it's something to keep an eye on.
YourKit Java ProfilerFinally a decent product, and from the only company I hadn't previously heard of! Installation was easy, it wasn't immediately clear how to start a profiling session but then I noticed the Eclipse Integration option and installed the Eclipse plugin. After that it was straightforward, launching the application in Eclipse automatically starts the YourKit application and its many, many profiling options. It's not perfect, the main problem from my point of view is that it seems more focussed on recording where objects were allocated rather than how they are currently referenced, which makes it easy to solve problems where an object is creating too many resources, but much harder to solve problems where objects that should have been garbage collected are being retained (which is Xena Lite's main problem). But eventually I figured out how best to use it (find large retained objects, and then use the "incoming references" function) and it has helped to solve one memory leak problem already. The best news about YourKit is that they offer the profiler free for use with open source projects, as long as you acknowledge them on the project website. Definitely a winner!
Borland OptimizeitBefore I finally figured out how to best use YourKit, I thought I might give Optimizeit a go. I had found it quite useful pinpointing a memory leak at a project I worked on for Defence a few years ago. I found it slightly clunky back then, and they don't appear to have updated the interface in the intervening years. The functionality is still there though, and it was working well until Xena Lite hung in the middle of a normalisation job. It turned out that this was Xena Lite's fault, but as I couldn't find a way to bring up the console I had no way to determine this. Optimizeit offers integration with Eclipse which might have fixed this problem, but the integration did not work (I think because it doesn't support Eclipse 3.1). Optimizeit is probably the best backup option if YourKit cannot be used for some reason.


